
HAS RISK EVAPORATED?
November 7, 2015
Let’s recap the price
action in the market for the year so far.
Stock prices essentially went sideways for 7 months until August
arrived. However, a number
of dynamics were developing prior to August that suggested weakness was
ahead and the market was coiling up like a spring ready to release.
Then in mid-August, the market broke to the downside and the Dow
slid 2,200 points in 5 days.
The market continued its volatility until the end of September.
Since then, we have seen market prices bounce back up to where
they were before the market dropped and are essentially flat for the
year once again.
Market participants
have waffled back and forth regarding thoughts on the global economy,
especially China, and what direction the Fed is likely to take with
monetary policy. Early in
the year, the market was expecting the Fed to begin raising rates.
Then, due to economic weakness and slowing global growth,
expectations flipped to pricing in very little chance they would start
to raise anytime this year.
Currently, thoughts have turned full course back to believing they will
raise interest rates in December.
It is increasingly
looking like the Fed is basing their monetary decisions on the moves in
the stock market and looking for any confirmation in the economy to
support getting off the zero bound.
You can overlay comments by members of the Fed on the price of
the stock market and see that they communicated that they were likely to
raise when stock prices were up and then reversed course when stock
prices dropped. The Fed is
turning their focus more and more to very short-term measures, and in
the environment we are currently in, it results in causing even more
uncertainty since it seems as though they are changing their minds
weekly.
In the midst of all
these changing and seemingly conflicting economic and market data, let’s
try to step back and see if anything has really changed much over the
last few months. Before we
look at a few indicators, we need to address the strong employment
report just released for the month of October.
Remember, the report last month was weak and was one of the
primary reasons market expectations for a rate hike subsided
significantly. Now, we get
a strong report and expectations regarding the Fed flip back the other
way. For now, the Fed is on
a clear path to raise in December but this could still change before we
get there. Let’s shift over
to look at a few broader economic indications than just the latest
employment report.
CURRENT ECONOMIC MEASURES ARE
NOT TRENDING HIGHER…
We can use ECRI’s
[Economic Cycle Research Institute] U.S. Coincident Index to get a good
sense of broad economic activity since it is a composite measure of
aggregate output, employment, income and sales.
This is a broader measure than just GDP.
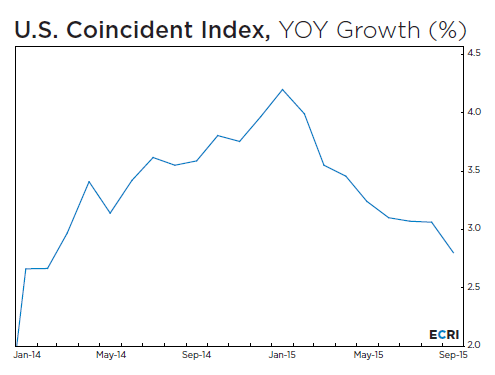
In the chart above, you
can see that broad-based economic activity has been slowing since the
first of the year and has not started to turn back up.
We can also look at a
chart by John Hussman which shows a number of economic activity
measures.
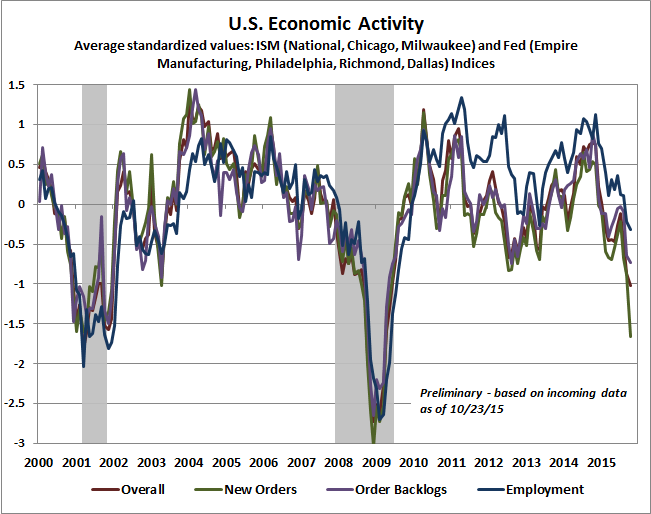
In the chart above, you
can see an overlay of a variety of economic indicators and he has shaded
the two previous recessions.
The direction and level of these measures shows how the economy
has been slowing.
LEADING ECONOMIC INDICATORS
ARE NOT TURNING HIGHER…
So, you can see from
the previous two charts that broad economic growth has been slowing for
much of the year. Does this
one employment report suggest that things are about to change and
economic activity is going to improve?
Well, the employment report
is generally not a good leading indicator of what’s to come and
can be quite variable as we have seen from just the past two reports.
Therefore, let’s take a look at a leading indicator that has been
pretty good in suggesting growth over the next quarter or two.
This is ECRI’s Weekly Leading Index.
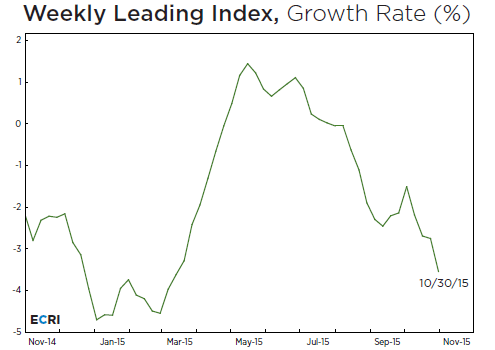
While their Coincident
Index captures a very broad measure of economic activity, their Weekly
Leading Index tends to give an indication of GDP readings about one to
two quarters out. If you
look at the chart above, you can see the weakness at the end of last
year which suggested the economic weakness in the 4th quarter
2014 and the 1st quarter of this year.
Then, the rebound at the beginning of the year in their Weekly
Leading Index forecasted the rebound in GDP for the 2nd
quarter of this year. The
Index then rolled back down beginning in May and forecasted the renewed
weakness in 3rd quarter GDP.
It is interesting that the index continues to decline, which
suggests that growth is not likely to strengthen in the coming months
and may actually weaken further.
CORPORATE EARNINGS ARE
DECLINING…
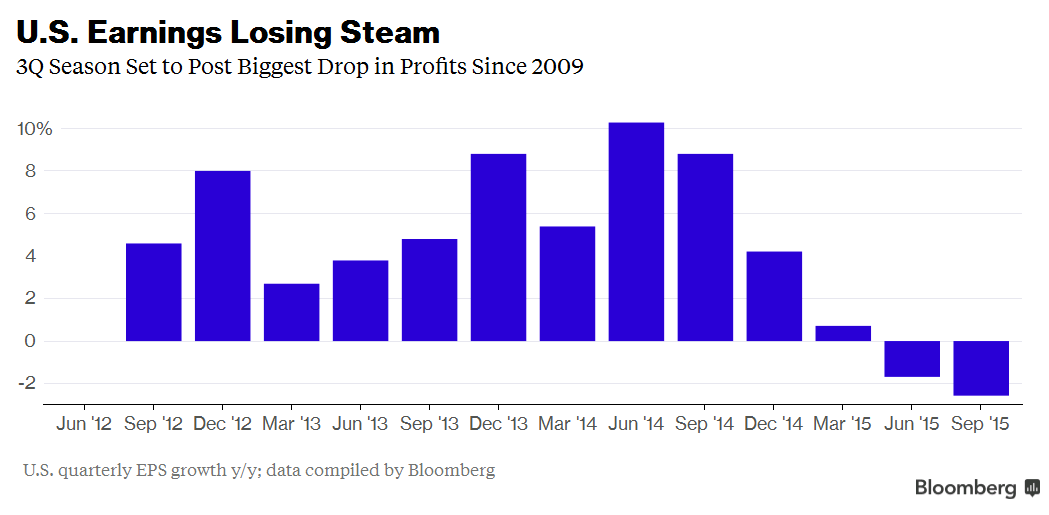
Now, let’s see what
effect the economy has had on recent earnings.
Bloomberg just reported that, “So far, about three-quarters of
the S&P 500 have reported results, with profits down 3.1 percent on a
share-weighted basis. This
would be the biggest quarterly drop in earnings since the third quarter
2009, and the second straight quarter of profit declines. Earnings
growth turned negative for the first time in six years in the second
quarter this year.” A
notable impact has been from energy and commodity related companies but
overall earnings have been muted and top line revenue growth even
weaker. Here is a Bloomberg
chart of earnings.
BASE METALS ARE STILL NOT
RISING…
It is not surprising
that commodity related company earnings have been weak since the
underlying commodity prices have been weak.
Here is a chart of a basket of base metals and does not include
the weakness in the oil markets.
These are base metals that are used in the global economy.
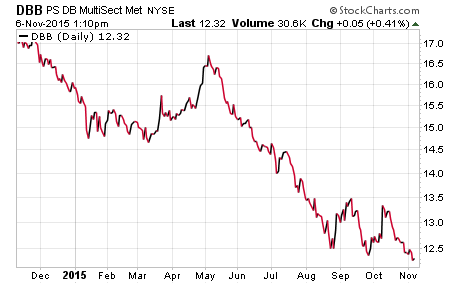
You can see the
temporary strength during the 2nd quarter of this year which
coincided with the better GDP report that quarter.
Then, the weakness that followed in the base metals was also
accompanied by weakness in the 3rd quarter GDP.
Currently, base metal prices have not turned higher and further
suggest that the strong employment report for October may not be an
indication of broader economic strength, especially globally.
CORPORATE PROFIT MARGINS ARE
ROLLNG OVER…
Now, where the stronger
employment report may have an upcoming impact is on corporate margins
with hourly incomes rising.
It appears that this may be a result of increases in the minimum wage
and the impact we are seeing with employment costs at companies like
Walmart. So, let’s take a
look at corporate profit margins from a historical perspective.
Here is a chart of profit margins going back to 1973.
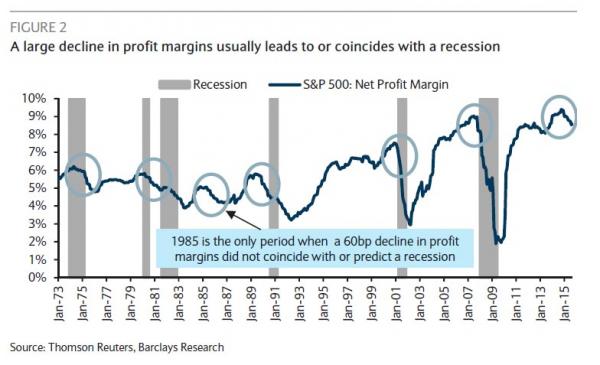
The chart above shows
profit margins with the blue line and the periods that are circled
indicate declines in profit margins by at least 60 basis points.
Previous recessions are the shaded areas.
The note on the chart in the blue rectangle indicates that 1985
was the only time where a 60 basis point decline in profit margins or
more did not coincide with or predict a recession.
As you can see at the end of the chart, profit margins have
rolled over from an all-time historical high and we will see if it turns
out to be only the second time we have seen this without a recession in
over 40 years.
CORPORATE DEBT HAS INCREASED
SIGNIFICANTLY…
While we are discussing
corporate earnings and profit margins, let’s also touch on corporate
debt. The consensus
thinking is that corporations continue to be flush with strong balance
sheets and plenty of cash.
However, more and more companies have been issuing debt fueled by the
ultra-easy monetary policy and much has been used to buy back stock.
Here are some highlights from a Bloomberg article on October 14th.
“Companies have loaded
up on debt. They owe more
in interest than they ever have, while their ability to service what
they owe, a metric called interest coverage, is at its lowest since
2009, according to data compiled by Bloomberg.
The deterioration of balance-sheet health is ‘increasingly
alarming’ and will only worsen if earnings growth continues to stall
amid a global economic slowdown, according to Goldman Sachs Group Inc.
credit strategists led by Lotfi Karoui.
Since corporate credit contraction can lead to recession, high
debt loads will be a drag on the economy if investors rein in lending,
said Deutsche Bank AG analysts led by Oleg Melentyev, the bank’s U.S.
credit strategy chief. ‘The
benefit of lower yields for corporate issuers is fading,’ said Eric
Beinstein, JPMorgan Chase & Co.’s head of U.S. high-grade strategy.
As of the second quarter, high-grade companies tracked by
JPMorgan incurred $119 billion in interest expenses over the last year,
the most for data going back to 2000, according to the bank’s analysts.”
“The fallout of more
borrowing coupled with lower earnings has raised concern among the
analysts who track the debt and the money managers who buy it.
Yet it seems the companies themselves are acting as if it’s not
happening. They’re still paying out record amounts in buybacks and
dividends. In the second
quarter, the most creditworthy companies posted declining earnings
before interest, taxes, depreciation and amortization.
Yet they returned 35 percent of those earnings to shareholders,
according to JPMorgan.
That’s kept their cash-payout ratio -- how much money they give to
shareholders relative to Ebitda -- steady at a 15-year high.”
“The borrowing has
gotten so aggressive that for the first time in about five years, equity
fund managers who said they’d prefer companies use cash flow to improve
their balance sheets outnumbered those who said they’d rather have it
returned to shareholders, according to a survey by Bank of America
Merrill Lynch. Since May,
stocks of companies that have spent the most buying back their shares
have performed even worse than the S&P 500 index.
That comes after buyback stocks outperformed the S&P 500 each
year since 2007, according to data compiled by Bloomberg.”
This article is talking
about high grade corporate debt, not junk bonds.
It is important to highlight that all this debt is not being used
for capital investment projects for future growth but instead has been
used to buy back stock to juice earnings per share in an environment
that has offered slow to no top line revenue growth.
Stanley Druckenmiller just this week discussed how everyone has
turned very short-term in their focus including the Fed, CEO’s,
investors, etc.
A company that has
excessive cash levels over and above what dividends they need to support
at comfortable payout levels as well as needs for capital investment to
fund future growth can be used productively to buy back their own stock.
However, companies are usually not good at this as they often buy
back the most shares near stock market peaks and high valuations and buy
back few shares after big price declines and at low valuations.
In the world of low to no top line revenue growth, levering up to
fund stock buybacks at the current high valuations to support short-term
earnings-per-share growth is likely to come back an haunt those CEO’s
and their respective Boards.
This will turn out to be another unintended consequence of
profligate monetary policy.
MORE NEGATIVE YIELDING ASSETS
AROUND THE GLOBAL…
Before I close for this
month, let’s take a brief look at a few global dynamics.
First, the amount of negative yielding assets in Europe continues
to increase as the following chart illustrates.
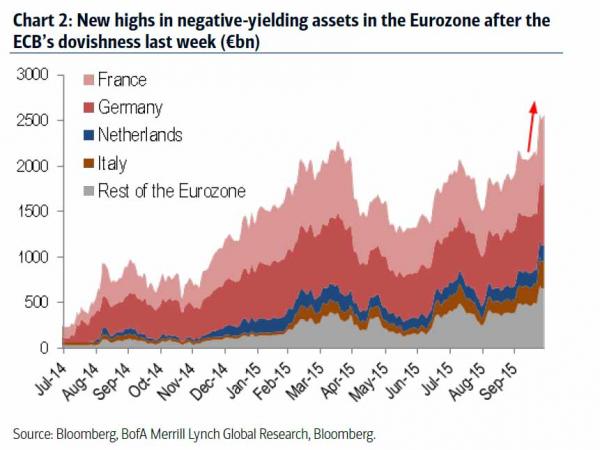
Deflationary pressures
continue to increase and the European Central Bank indicated last week
that they will likely add to their already $1 trillion a year run rate
in money printing. China is
likely to continue to cut rates and even here in the U.S., 3-month
Treasury Bills auction at 0% a few weeks ago.
It is also important to note that in the past two weeks, the two
most prominent Fed members [Yellen and Dudley] both said that negative
rates here in the U.S. are on the table if they perceive it is
warranted. Going negative
here in the U.S. like many parts of Europe was previously thought of as
extreme and would never happen.
It is no small change in thinking at the Fed for these two
members to clearly state that negative rates are a viable policy tool.
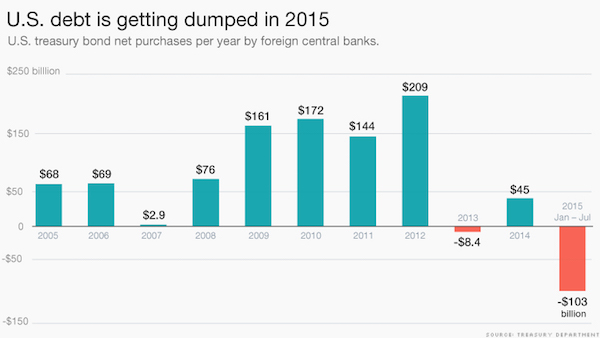
CAPITAL CONTINUES TO FLOW OUT
OF EMERGING MARKETS…
Due to the slowdown in
China and the related impacts to growth around Asia, capital is flowing
out of emerging market economies.
It is impacting capital reserves and as a result U.S. Treasury
bonds are being sold. Here
is a chart that reflects this recent dynamic and it is likely to
continue and may accelerate.
Let’s go ahead and wrap
up for this month.
The latest employment
report has turned market expectations to thinking that growth may be
picking up and that the Fed is going to raise rates in December, after
having the opposite view of both as recently as a few weeks ago.
This flip-flopping is likely to continue.
Also, it is worthwhile to note that the “strong” employment
report for October continues to show that it is the low paying, low
quality jobs that showed strength and that is where minimum wage
pressures are found most.
Growth has been
weakening around the globe and here in the U.S. for most of the year,
and in view of ECRI’s leading indicator it does not appear that the
economy is likely to improve in the coming months.
In fact, it may continue to weaken.
This has impacted corporate earnings, and profit margins continue
to roll over from all-time highs.
Corporations have issued large amounts of debt to fund stock
buybacks for short-term earnings performance and as a result we are
starting to see signs of balance sheet deterioration.
Deflationary pressures
continue around the globe, and as more interest rates are going lower
and into negative territory, our central bank just put going below the
zero bound on the table.
Currently, market participants believe the Fed will raise rates in
December. However, I
continue to think that the data will either continue to weaken enough
before their meeting in December and they will not raise, or they will
raise and the data will weaken afterward and they will reverse course as
claims of a “policy mistake” surface.
I would have preferred that the Fed never went to the zero bound
or printed money but this is more about what is likely to happen than
what should happen.
DRUCKENMILLER’S PERSPECTIVE…
As for market
implications, let’s look at what Stanley Druckenmiller said in an
interview this week at a New York Times investment conference.
I have highlighted Druckenmiller many times as he is probably the
best investor in the last 50 years.
“You’re pulling demand forward today, this is not some permanent
boost. You’re borrowing
from the future,” Mr. Druckenmiller said. “The chickens will come home
to roost,” warned Mr. Druckenmiller, who has been a frequent and vocal
critic of the Fed and its policy of near-zero interest rates.
“I can see myself getting very bearish, I can’t see myself
getting bullish,” he said. Mr.
Druckenmiller also told the audience that some of his best returns had
been in “great periods of chaos.”
One of his important
perspectives that he shared is that he is currently operating under the
assumption that a primary bear market started in July.
If he is correct, the declines in August and September were the
first wave down and this subsequent bounce in stock prices will roll
back over and we will see prices break below the lows in August.
Although investors have
become bullish once again as a result of the latest bounce this past
month, risk remains high.
If Druckenmiller is right, we will see what Yellen and Dudley put on the
table of acceptable monetary policies this past week become reality in
2016. The investing
environment will become even more interesting if the majority of the
world’s interest rates go negative for the first time in history.
Joseph R. Gregory, Jr.