
FASTEN YOUR SEATBELTS
August 7, 2015
In my last commentary,
I discussed how volatility was increasing in a number of areas of the
market. The major indices
have not broken down yet and this has masked the building weakness under
the surface of the market.
Let’s continue our review from last month with updates on the current
condition of the financial markets.
To start, let’s look at
another indicator that reflects how the broader range of stocks is
performing. The 200-day
moving average is often used as a longer-term trend line for the price
of a stock. It is a simple
average of the price of the stock over the last 200 trading days.
It is just one trend line that can be used to get a sense of
whether the stock is in a longer-term move higher or whether it is
starting to trend lower.
The chart below shows the percentage of stocks trading above this
longer-term trend line for the NYSE, a very broad composite of stocks.
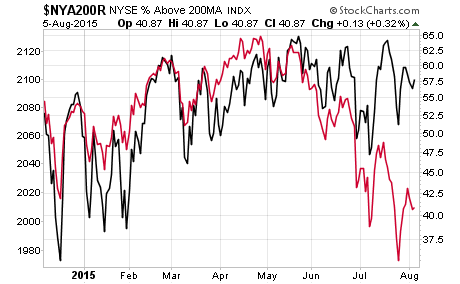
The above chart shows
the percentage of NYSE stocks trading above their 200-day moving average
with the red line and the S&P 500 with the dark line.
The red line shows that about 65% of stocks were trading above
their long-term trend line back in late April and then the percentage
started to decline. The S&P
500 peaked about a month later and has been in a volatile range sideways
since. Over the past few
months more and more stocks have been breaking down below their trend
lines and the divergence between the performance of most stocks and the
major indices has been growing.
This gap between the two lines is likely to close in the next
month or two and suggests that further weakness is ahead.
EXTRACTING ALL THE EARNINGS
YOU CAN…
From a fundamental
perspective, earnings growth has outperformed top line revenue growth
for some time now. Trend
economic growth as reflected by GDP has persisted around the 2% range,
which impacts revenue growth.
Two dynamics have inflated earnings growth at a higher rate than
usual. One is that profit
margins rose to all-time highs over the past few years and have yet to
revert back to the long-term average.
Typically, as long as capitalism is working this is one economic
variable that is very mean reverting, which Jeremy Grantham has
repeatedly discussed.
Second, the extreme monetary policy has encouraged excessive issuance of
debt to fund stock buybacks instead of investing in capital projects and
this inflates earnings per share in the near-term.
These two dynamics have been going on for the past few years and
may run its course before long as far as extracting as much earnings per
share possible out of the tepid top line revenue growth.
THE FED BETTER HOPE THEIR
ATLANTA COUNTERPART IS WRONG…
It is interesting to
note that the Atlanta Fed has an economic forecasting model that has
been more accurate than most in the recent period for predicting
near-term GDP growth. The
Federal Reserve Board should probably pay a little more attention to it.
So, their latest forecast for 3rd quarter real GDP
growth was just released at a whopping 1%.
Here is a chart which shows the consensus forecast by economists
on Wall Street compared to the Atlanta Fed forecast.
This chart shows that
the consensus is currently over 2% more than the Atlanta Fed which
highlights rising probabilities of disappointment for the markets and
continued weak top line revenue growth.
BASE METALS SUGGESTS GLOBAL
ECONOMIC WEAKNESS…
Next, let’s take a look
at an index of base metals which includes copper, aluminum and zinc.
One reason for looking at the prices of base metals is that these
are heavily used in the economy and can give at least an indication of
global growth.
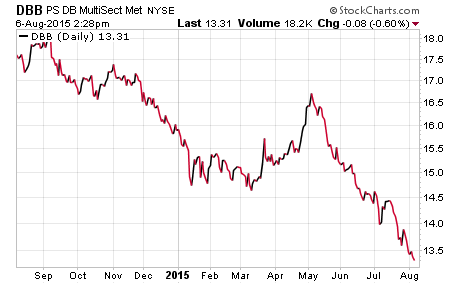
This chart above shows
a dramatic decline in the prices of base metals.
China has been the marginal buyer of these types of commodities
so it is definitely being impacted by the slowdown there.
However, if the other economies around the world were growing at
a healthy rate, it would help stabilize pricing.
This suggests that the global economy continues to weaken and the
likelihood of upcoming economic disappointment.
EMERGING MARKET RISKS…
The decline in
commodity pricing, the slowdown in China and the rising U.S. dollar is
also pressuring emerging markets.
One area to monitor as a clue to the direction of the emerging
market stocks are their currencies.
John Murphy of StockCharts recently highlighted two charts on
this topic. Let’s take a
look.
The chart below shows a
basket of emerging market currencies in green and the emerging market
index in red.
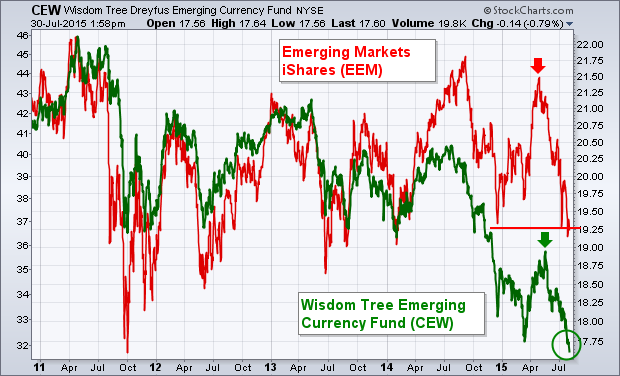
The chart shows that
the currencies and the stock markets tend to correlate together.
In the last year, the currencies have begun to weaken more
dramatically and have recently diverged from the stocks.
The currencies are suggesting that a break down in emerging
market stocks may be coming.
The next chart shows a longer-term view of emerging market
stocks.
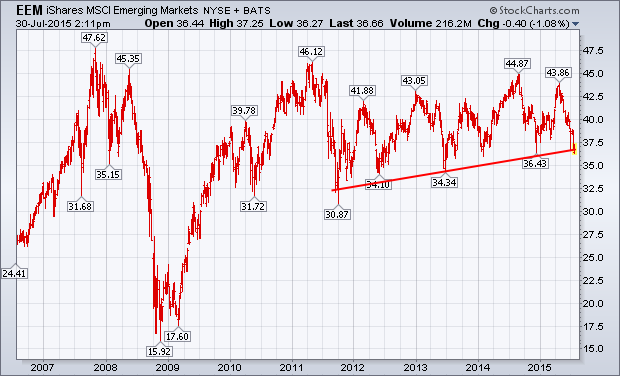
This chart shows that
the emerging market stocks sitting right above the red trend line and
the currencies suggest that this trend line may be broken soon.
“POLICY MISTAKE” IN THE EYES
OF THE MARKET JUST AHEAD???
Now, let’s tie this in
with the primary focus of the market right now, and that is whether or
not the Fed is going to raise rates a quarter of a point off the zero
bound in September. As I
have said many times, the Fed should never have taken rates to zero and
should not have started up their printing press as these actions distort
market prices, encourage the misallocation of capital and eventually
leads to more pain for the economy and investors.
They have maintained this extreme monetary policy for so long
that they are backed into a box.
So, the Fed seems
intent on getting off the zero bound no matter what in September.
I continue to believe that
either they will not raise rates this year or if they do, the market
will later view it as a policy mistake.
They will likely get cold feet and decide to hold off, but if
they do raise in September, imagine what market participants will say if
the Atlanta Fed model comes true for the 3rd quarter.
If they raise and subsequently, 3rd quarter GDP comes
in anywhere near 1%, the pundits on CNBC will flip as will markets.
Going down the policy path that Bernanke created has
unfortunately made the markets much more linked to future policy
decisions than we have historically seen.
It is going to get
interesting as we move through the next three months.
Market internals are weakening, the economy continues to slow,
commodities continue to decline, and other signs of stress are appearing
such as in emerging markets.
And, the Fed seems intent on raising rates.
Risk is rising and August through October has often been unkind
to markets. Make sure your
seatbelts are fastened as the ride may start to get bumpy.
Joseph R. Gregory, Jr.