
TO RAISE, OR NOT TO RAISE
March 7, 2015
The employment numbers
just released for the month of February showed job gains of 295,000 and
the unemployment rate fell to 5.5%.
The headline numbers were much stronger than anticipated so the
immediate reaction was an increase in expectations that the Federal
Reserve will begin to raise rates starting in June.
Interest rates rose across the curve sending stocks down,
especially those that pay higher dividend yields.
This month, let’s take
a look at whether the immediate reaction by the market to the latest
jobs numbers will likely continue.
How this scenario plays out will be a primary driver for global
markets for the rest of the year.
In the midst of this
latest focus on whether or not our central bank will raise rates, let’s
first see what other central bankers are doing because once the world
enters the currency competitive devaluation game, it’s all relative.
During the month of February, at least 20 central banks around
the globe cut rates or eased monetary policy which in effect covers over
50% of the world’s population.
March is starting out with a bang too, as the European Central
Bank [ECB] will start their open ended quantitative easing program on
Monday, March 9th, by printing 60 billion euros a month.
So, while the world continues to push the pedal to the medal with
easy monetary policy, and market participants now expecting our central
bank to actually raise rates in June, what do you think has happened to
the U.S. dollar?
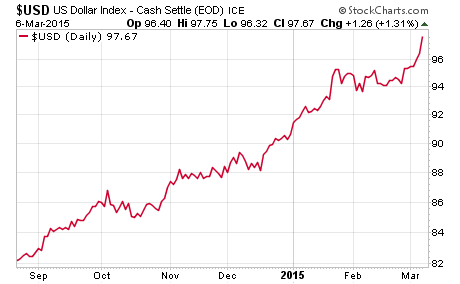
The chart above shows
that the U.S. dollar against the trade-weighted basket of currencies has
risen over 20% in the last seven months.
That is a very significant move in the currency markets.
So, while the world
central banks continue to aggressively ease monetary policy, causing
most every currency around the world to slide at an increasing rate
against ours, are market participants going to be correct in predicting
that our Fed is going to start raising rates for the first time in
almost seven years off the zero bound?
I don’t think so…
Actually, as I have
mentioned recently, either they will not raise rates this year, or they
will and the market will subsequently view it as a policy mistake.
I would have preferred that the Fed never dropped rates this low
in the first place and they should have raised them earlier.
Cutting rates to the zero bound and leaving them there for so
long increasingly puts the Fed into a box making it more and more
difficult to normalize rates.
Now, let’s look at some
recent data to see how likely the Fed is to start raising rates.
First of all, the quality of the job additions continue to be low
tier as bars and restaurants are the leading category of new hires.
Any consumer savings from the drop in gas prices looks to be
going toward eating out with what is left over from paying increases in
health care.
SHOW ME THE MONEY…
In addition to the
types of jobs, we can look at wage growth to get another indication of
the health of the job market.
The chart above by ECRI
shows average hourly earnings growth.
This weak trend indicates that the underlying employment picture
remains subdued and makes it no surprise that the latest personal
consumption data continues to be weak as well.
IS THE U.S. ECONOMY ABOUT TO
GET STRONGER???
Let’s take a look at
the latest weekly leading index by ECRI to get a sense of whether or not
we should expect the economy to pick up any steam as the headline
employment data suggested today.
If you look at the
recent growth rate of ECRI’s leading index, it has dropped considerably
and this tends to lead the economy by four to six months.
PROFITS OFTEN LEAD THE
ECONOMY…
Now, let’s look at
profit expectations. The
following chart by Albert Edwards at SocGen shows the 6-month change in
earnings expectations for the upcoming year with the red line.
Then, he shows real U.S. GDP growth in the light blue line.
This chart covers roughly the last 30 years.
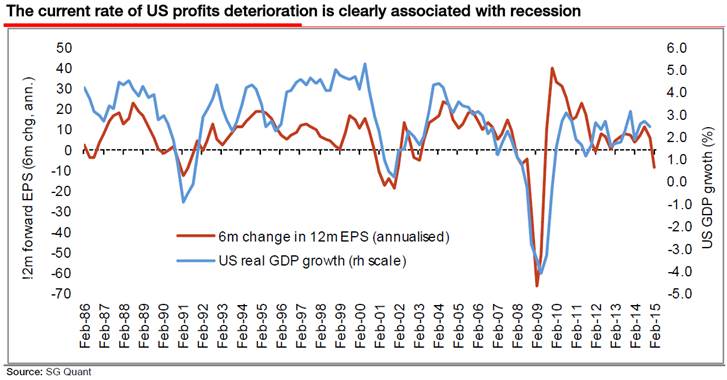
Looking at the right
side of the chart, you can see the sharp drop in expected earnings
growth. Then, look back
over the chart and you can see that this red line of earnings
expectations tends to lead the blue line of GDP growth.
Also, if you look back to the previous time the red line dropped
this low, it has been associated with the start of a recession such as
1991, 2001 and 2008.
OUR INFLATION UNDER THE
EUROPEAN PARADIGM…
Next, let’s look at
another interesting view of inflation that Edwards at SocGen created
with the following chart.
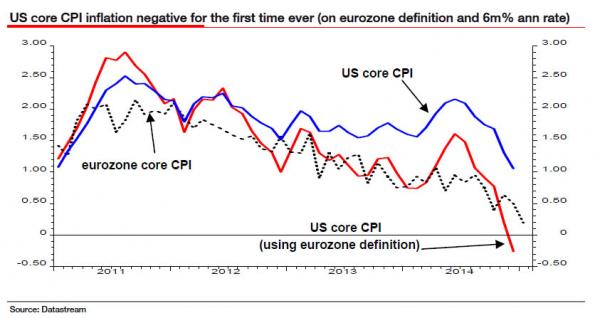
The chart above shows
the 6-month annual rate of change on different inflation metrics.
The blue line is the U.S. core CPI and you can see the latest
trajectory. Then, the
dotted line is the Eurozone core CPI which shows weaker inflation
numbers than the U.S. Then,
Edwards shows an interesting line with the red one.
That shows what the U.S. core CPI would be using the definitions
that make up the Eurozone CPI.
Looking at this metric which you could argue makes more of an
apples-to-apples comparison, helps to put the global inflation picture
into better perspective. By
the way, the ECB is just now launching their open-ended QE program
because of this inflation picture, in addition to wanting a weaker
currency.
NEW ORDERS FOR FUTURE GROWTH…
Let’s continue on…
The next chart shows the value of manufacturers’ new orders for
all manufacturing industries here in the U.S.
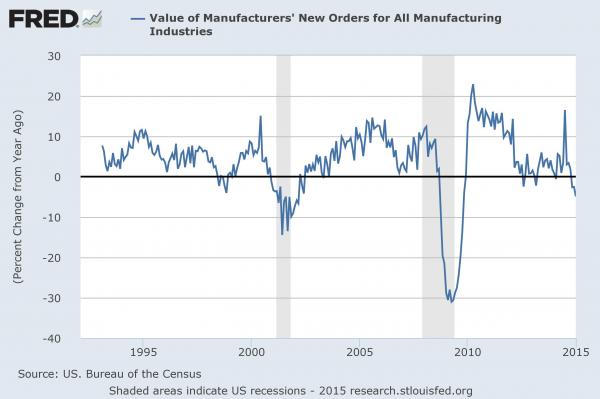
Looking back through
the chart above, usually when this drops this low, we are entering a
recession.
GLOBAL ECONOMIC GROWTH AS
SEEN BY GOLDMAN…
Now, let’s look at the
global economic picture to get a sense of why all most all of the other
central banks around the world continue to ease monetary policy in
aggressive, and previously thought to be unorthodox, ways.
We can do that by looking at two charts from Goldman Sachs.
The first chart shows
their GLI Momentum indicator versus global industrial production.
GLI stands for global leading indicator and suggests the upcoming
path to global economic growth.
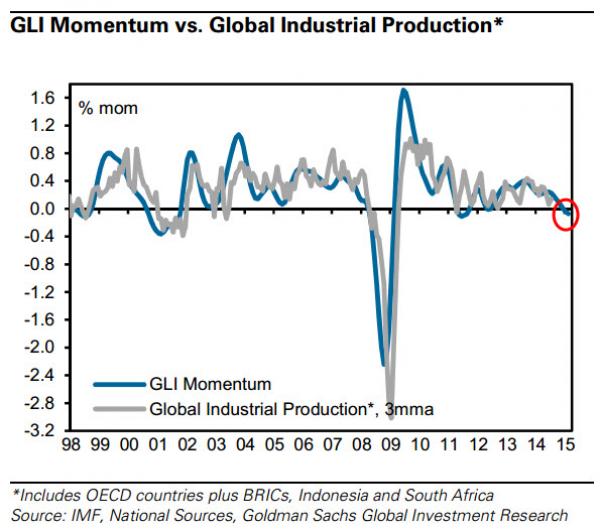
The chart above shows
that Goldman’s indicator is suggesting continued global economic
weakness that is getting weaker.
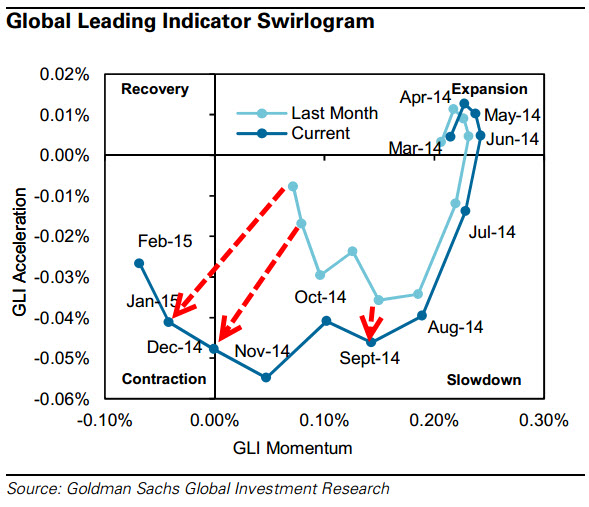
We can put that
longer-term chart into closer perspective with the following chart.
The chart below shows that same GLI Momentum in what they call
their Swirlogram. Don’t you
love how economist can create all kinds of charts to illustrate a point
[even though I can’t complain too much since I am using it to help make
my point]…
Anyway, let’s try to
simplify it. The chart
shows four quadrants, one for economic recovery, then expansion, then
slowdown and in the lower left, economic contraction.
The light blue line shows how their global leading economic
indicator was tracking last month and the darker blue line shows the
most recent readings. They
do not reveal what causes the adjustments but it is likely a mix of
revised previous economic data as well as updates to the latest economic
reports.
Then, if you track the
path of the dark blue line, you can see what their global leading
indicator suggested since beginning back in March of last year.
The main point we want to focus on is that it has migrated from
expansion, to slowdown and now has moved firmly into the contraction
quadrant.
So, Goldman’s Global
Leading Indicator is now suggesting that the global economy is moving
toward not just a slowdown but into a contraction.
Let’s wrap up…
We have had a string of monthly job reports which on a headline
basis seem very strong.
Yesterday, market participants shifted notably in strengthening their
convictions that the Fed is going to raise rates beginning in June.
Now, go back and take a quick review of the charts above showing
wage growth, ECRI’s leading indicator for the U.S. economy, U.S. profit
expectations, U.S. inflation data, new orders for the manufacturing
sector, and Goldman’s leading indicator for global economic growth.
Also, note that the government jobs numbers are a lagging
indicator for economic purposes.
Now, put that in
context of our Federal Reserve’s modus operandi and you may come to the
same conclusion that it will be surprising if they actually do begin to
increase rates in June. Our
Fed started this game of competitive devaluations and they are rapidly
getting behind the others that have joined the game.
That adds another dimension to the prospects of rate hikes that
the Fed normally does not face in trying to normalize policy.
If the Fed does go
ahead and raise rates based on the headline employment numbers, and
these various leading indicators are anywhere near correct, financial
markets will not react well and the market pundits will be out all over
the TV blaming the Fed for a late 1930’s type of policy mistake later
this year.
RIDE THE ECB TRAIN…
Before I close, let’s
address two final thoughts.
One is that the market is already front-running the ECB with money flows
starting to turn rapidly toward investing in Europe.
Market participants have already seen that the money printing by
our Fed did not go into the real economy but rather into financial
assets and they are expecting the same dynamic in Europe, which is has
pretty good odds. Same
thing happened in Japan as well, so why not Europe.
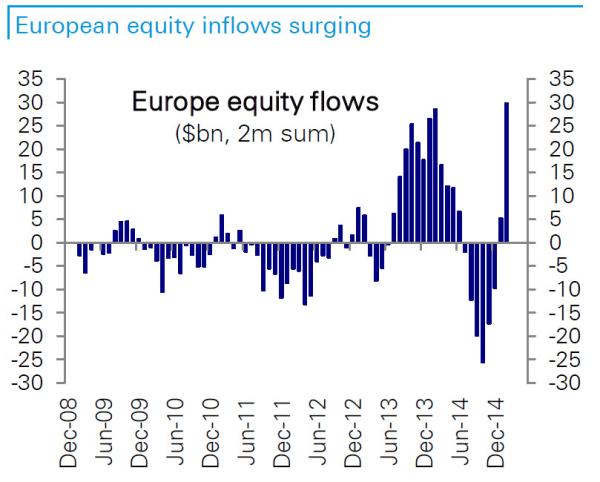
Here is a chart showing the latest money flows into European
equities. The spike in the
last bar on the right show the greatest monthly inflow in quite a while,
right before their open-ended QE starts.
The final point for
this month is that we are starting to see signs of the next phase of the
playbook when it comes to game theory and the global fight for growth
through trade, while battling deflationary pressures.
A few years ago, when our housing bubble popped and we went into
a recession and financial panic, the global economies began to weaken as
well. Bernanke started the
world down this path of printing money to inflate asset prices and
deflate our currency and try to resuscitate slow domestic growth through
the wealth effect and by capturing more of global trade.
Remember, as your currency declines, your country’s goods become
cheaper for others to purchase around the world.
Now, we have seen all
the global central banks join this game of trying to depreciate their
currency. This is not an
“absolute” game but a “relative” one because currencies are all priced
relative to another one. As
one central bank acts, the next one must act with more force or in a
timely fashion to gain the next competitive edge in the currency game.
That is why it is called competitive devaluations.
Each country is competing against the other to have the weaker
currency and make their products cheaper.
NEXT PHASE OF THIS GAME
THEORY GETS INTERESTING…
The next phase in the
game of countries competing in this environment is trade protection.
When one of the players starts to see an endpoint for what they
can do on the currency front relative to the other players, they begin
to resort to other tactics.
The next tactic is protectionism and we are starting to get a whiff of
that in our Congress. We
led the world in this currency game and we may end up leading the world
to the next phase.
Here is a report from
Reuters on February 9th.
“A bipartisan group of U.S. lawmakers will unveil legislation on
Tuesday aimed at stopping trading partners from manipulating their
exchange rates to gain a competitive edge amid a wider debate over using
trade deals to punish currency cheats.
Democratic Senators Sherrod Brown, Debbie Stabenow and Charles
Schumer will be joined by Republicans Jeff Sessions and Lindsey Graham
in presenting the measure.
The legislation, which is similar to bills introduced in previous years,
would treat currency undervaluation in a similar way to subsidies
provided by foreign governments and allow U.S. companies to seek
compensatory duties on imported goods.
It will also set out consequences for countries that fail to
adopt appropriate policies to eliminate currency misalignment, according
to a joint statement from the senators.
An identical bill is planned for introduction in the House of
Representatives by Democrats Sander Levin and Tim Ryan and Republicans
Tim Murphy and Mo Brooks.
Many lawmakers are also
keen to write rules against currency manipulation into free trade
agreements such as the Trans-Pacific Partnership. The 12-nation TPP
includes Japan, whose currency has depreciated about a third against the
U.S. dollar over the last three years.”
This is so unbelievably hypocritical since our Federal Reserve
started this whole mess of printing money in the first place.
Bernanke started this
game and it looks like it is going to get more interesting yet…
Joseph R. Gregory, Jr.