
"POLICY MISTAKE"
January 11, 2016
My last market
commentary was titled, “Global Recession Risks Are Rising.”
This month, I want to highlight how probabilities have increased
for a global recession based on the price action in various areas of the
market. I will also include
a few new data points on the economic front.
First of all, the first
week of the New Year was the worst first week for the stock market of
any new year since 1930.
The S&P 500 is now down about 10% from its high last May.
However, the weakness in many areas of the market is much more
significant than the broader averages.
We can look at some of these areas to see if they suggest what
may be going on with the economy.
Base metals like
aluminum, nickel, zinc and copper are core metals used in the economy.
The chart below shows an ETF which tracks a basket of these metal
prices.
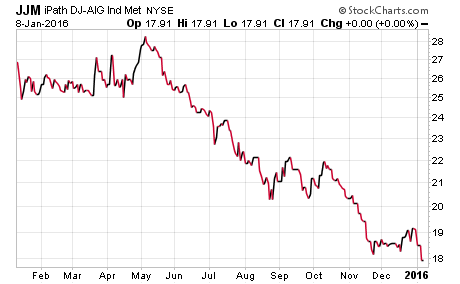
You can see how the
prices of these economically sensitive metals have been declining
sharply and the basket is down over 35% from its recent high.
Next, let’s take a look at the stock prices of a few
transportation companies since those companies move the goods within the
economy. The first company
shown below is Union Pacific.
This railroad company transports a wide variety of products.
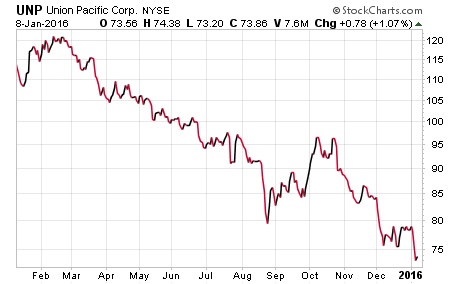
The chart above shows
how Union Pacific’s stock has dropped by almost 40% recently.
Next, let’s take a look at the largest North American trucking
company; JB Hunt.
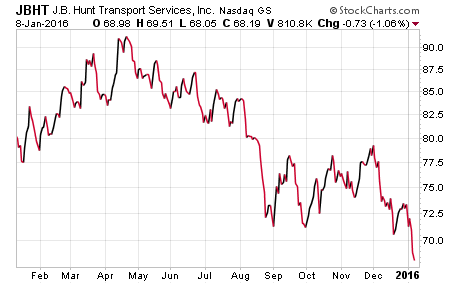
JB Hunt’s stock price
has declined by about 26% recently.
From a global transportation perspective, Federal Express’ stock
has declined by a little more than JB Hunt.
Next, let’s take a look at a stock which is directly affected by
consumer credit and spending; Capital One.
It has over $300 billion in assets and is one of the largest
credit card companies and has significant exposure to other consumer
lending areas such as auto loans.
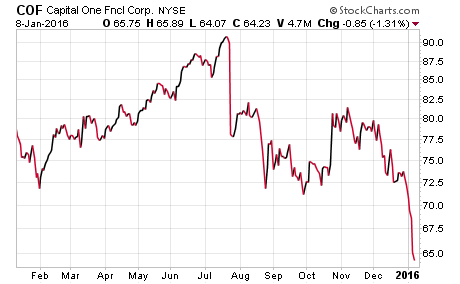
Capital One’s stock has
declined by 29% recently.
Next, let’s look at an ETF for the retail sector to get a sense of
consumer spending. It is a
very broad-based index of many types of retail companies.
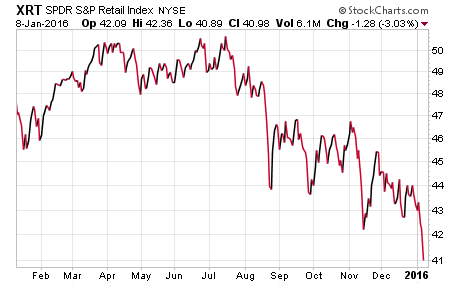
The chart above shows
how the retail sector has declined 20% lately.
Next, let’s look at what has been the two strongest segments of
the economy; autos and housing.
The first company is AutoNation, which is the largest auto dealer
in the country.
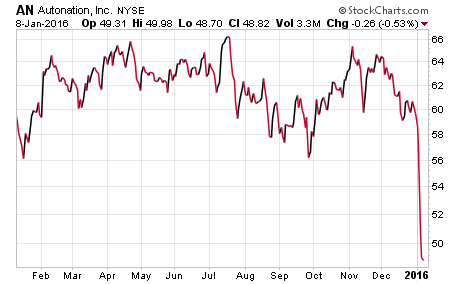
While it had been
holding up in the midst of all the pundits celebrating the strong auto
market, things changed this past week as their CEO said sales are
slowing, promotions are rising, inventory is bloated and the environment
has changed. The stock is
now down around 26% from its recent high.
Next, let’s look at the homebuilders as an indication of the
housing market. Here is an
ETF of the largest homebuilders.
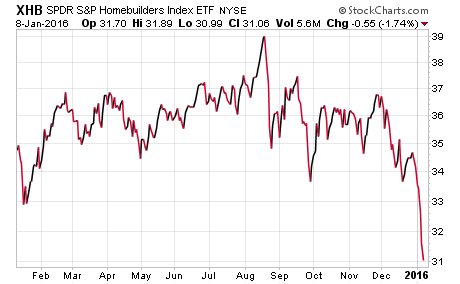
After the recent drop,
it is down over 20%. Let’s
also take a look at the largest realty company in the U.S.; Realogy.
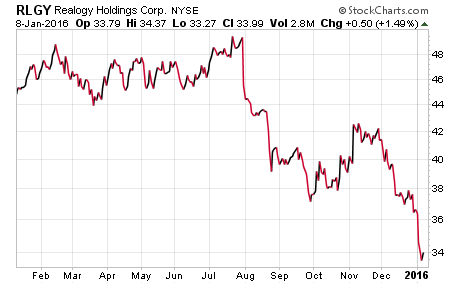
It has decline by over
30% from its recent high.
Now, let’s look at a few international stock markets.
First, here is the broader emerging markets index.
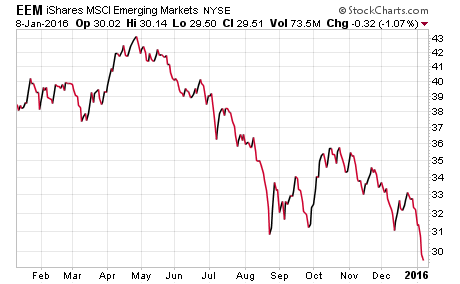
The emerging markets
index has fallen by around 33% recently.
Let’s look at the EAFE index next [Europe, Australia, Far East].
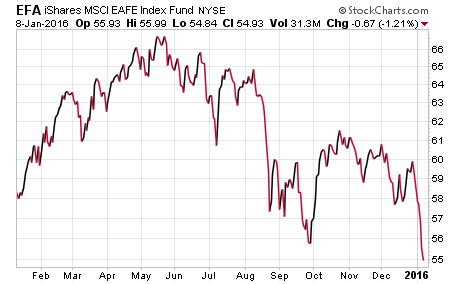
This index has dropped
by more than 21% lately.
Canada is next.
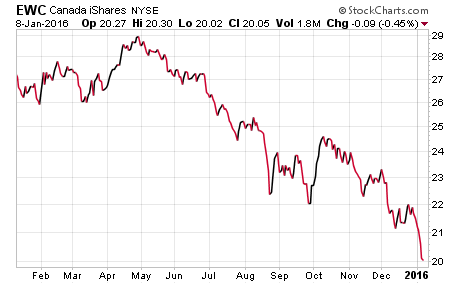
Canada’s major index
has fallen by 31%. Now
Mexico.
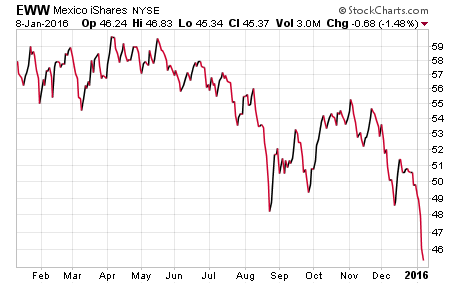
Mexico’s stock market
has dropped by 24% lately.
I could show more, but you probably don’t want to see how bad it is in
some of the economic disaster countries such as Brazil.
Remember, Brazil was one of the hottest areas to invest in not
long ago as it represented the first letter of the BRIC’s acronym.
Also, notice I did not
include Japan which is still a significant part of the global economy.
Their market is starting to roll over as well, but things are so
distorted from all of their monetary policies it is ridiculous.
Bloomberg noted in an article back in October that the Bank of
Japan already owns more than half of their country’s market for ETFs.
That is like Janet Yellen and her crew buying up over half the
stock index funds here in our country to support stock prices.
The charts above
include base metals, railroads, truckers, consumer finance, retail,
autos and housing. Each are
in technical bear markets already, which is a decline of 20% or more.
The significant market declines representing various segments of
the economy further suggests that the ongoing slowdown is likely
developing into the next recession.
The world economy has been slowing, reflected by the
international charts above, and the weakness is increasingly coming onto
our shores. Don’t be fooled
into believing the “decoupling” myth; that the U.S. economy can decouple
from the rest of the world.
GLOBAL TRADE CONTINUES TO
WEAKEN…
Now, let’s look at
trade as another indication of the economy here and around the world.
Here is a chart by ECRI [Economic Cycle Research Institute]
showing both U.S. export volume growth and export prices.
The chart above shows
export volume growth and prices and they are on a trajectory similar to
the last two recessions; in ’01 and ’08.
ECRI also notes that world export volume growth is at a 34-month
low.
A GROWING SUPPLY/DEMAND
IMBALANCE…
Next, let’s look at
business inventories in the economy relative to sales.
Here is a chart by ECRI illustrating this.
The chart above shows
how the gap between inventories and sales is growing wider.
As a result, the inventory-to-sales ratio is at the highest level
since June 2009. This is
going to add pressure for companies to cut production to get inventories
back in line with slowing sales.
It is no wonder the ISM manufacturing index fell further into
contraction territory for the second month in a row.
Raoul Pal, from The Global Macro Investor, recently commented
that the current level of the ISM manufacturing index suggests that the
probabilities of a recession are already at 65%.
Given the latest inventory-to-sales ratio, this ISM reading will
likely continue to decline, raising the probability notably higher.
Before I close, let’s
take a look at two more items; one is corporate balance sheets and the
other is oil inventories.
CORPORATE BALANCE SHEETS NOT
PREPARED FOR A RECESSION…
Let’s look at a chart
relating to debt on corporate balance sheets.
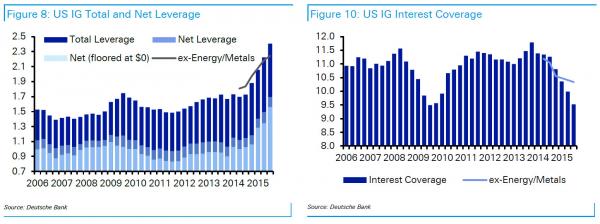
The chart above shows
the growing leverage on investment grade company balance sheets in the
first pane and the related interest coverage [ability for companies to
service the debt] in the second pane.
You can see how the leverage is reaching new highs and notably
above the level after the last recession in ‘08/’09.
Also, interest coverage is trending back down toward the levels
seen after the last recession.
It is worth noting that
after a deep recession like the last one, it would not be unusual for
leverage to rise and interest coverage to decline as a result of the
sharp drop in economic activity.
That would be due to a deterioration on the asset side of the
balance sheet and a decline in cash flows.
On the other hand, if you see this deterioration prior to a deep
recession, that is indicative of more obligations on the liability side
of the balance sheet and a related increase in servicing those debts
from an interest coverage perspective.
A notable increase in leverage on corporate balance sheets and a
decline in interest coverage prior to a recession will likely present
greater challenges for CFO’s in the period ahead.
As I have discussed
many times recently, corporate balance sheets have deteriorated and
Goldman Sachs continues to raise red flags regarding this issue.
Excluding the finance sector, they are in worse shape to deal
with a recession than they were at the peak in 2007.
Let’s look at this
issue from another angle.
In a healthy economy, corporations issue debt to fund new projects.
As those new projects are developed, they generate future cash
flows which then provide the means to service the debt that funded the
projects. In the past few
years, corporations have found fewer and fewer new projects to fund, as
evidenced by muted capital spending.
Instead, many have decided to use the cheap financing enabled by
the Fed to issue debt and use the proceeds to buy back stock.
This helps to reduce the number of shares outstanding, and as a
result they get a temporary boost to earnings per share.
However, as corporations have levered up their balance sheets,
the stock they bought back does not generate any future cash flow to
help service the additional debt.
And, they have been buying their stock at elevated valuations.
This focus on short-term stock performance will likely present
longer-term challenges.
SEASONAL PATTERN IN OIL A KEY
FACTOR AHEAD…
Next, let’s take a
quick look at another topic; oil inventories.
So, in December, we saw a notable decline in oil inventories
which has made some analysts more constructive.
The issue is that oil inventories tend to have their biggest
monthly declines in December each year for different reasons such as
taxes. Here is a chart
which shows average changes in oil inventories for each month of the
year.
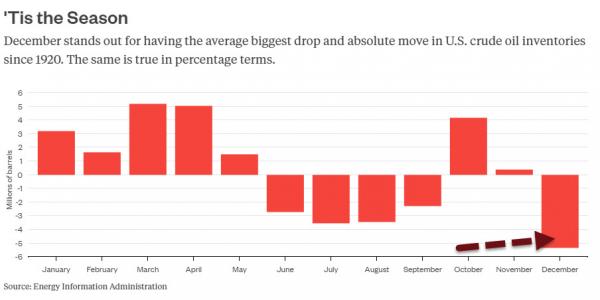
The chart above shows
how oil inventories usually decline in December by the greatest amount
in any month of the year but then build in the first five months of the
following year. Also, the
recent inventory data for Cushing is showing that storage capacity is
getting very full. While
rig counts continue to decline and production has declined some,
production needs to be cut more to get the balance of supply and demand
back in check. If the
global economy is slipping into a recession, demand is going to decline
as well which puts more pressure back on additional production cuts to
get supply into balance.
Just recently, credit default swaps are indicating more default risk to
Saudi Arabia than Portugal.
As a result of the ongoing supply/demand dynamics and seasonal patterns,
oil prices may flush lower in the period ahead and if so, related
geo-political tensions will likely rise.
WILL 2016 RHYME WITH 1937???
Let’s wrap up.
All of the stock charts that I showed above, which reflect
various segments of our economy as well as the global economy, add to
the evidence that the probabilities of a global recession continue to
grow. Looking at those
charts make the declines in the S&P 500 seem very mild, even after the
worst first week in a new year since 1930.
It is likely time for the major indices to play a little catch
up.
One of the building
concerns for the U.S. economy is the growing gap between inventories and
sales. Exports are not
helping corporations either as global trade continues to weaken.
Finally, corporate balance sheets are not well prepared to deal
with a recession as they have levered up in order to achieve short-term
performance metrics through stock buybacks, partly due to pressure from
their investors.
The final point in the
discussion above relating to oil prices is important since the general
market has been tracking the direction of oil in recent weeks.
If oil prices break into the 20’s in the coming period, it will
add further pressure to the overall market.
Now, consider the Fed
and their recent decision to raise rates.
I said all last year that they will either not raise rates or if
they do, it will subsequently be viewed as a policy mistake.
They should not have ever into entered this black hole of
unconventional policies but Bernanke led the global central banks down
this path and it is becoming increasingly difficult for them to get out
of it. You are going to
hear more and more about the implications of a “policy mistake” similar
to 1937 as this year progresses, especially if the global economy is
entering a recession. The
Atlanta Fed GDPNow model, which incorporates the latest economic data is
suggesting that 4th quarter GDP has decelerated down to 0.8%
growth here in the U.S.
We led the Europeans
down the path of printing money and I think they are going to lead us
and Canada down the path of negative rates.
Remember, this is about what the Fed will likely do and not about
what they should do. I
think Janet Yellen and her team will likely realize that they raised
rates just ahead of a recession and they will reverse course.
However, they will not stop at the zero bound this time but go
negative and start printing again, as that is what the Europeans are
doing as we speak. Who
knows, maybe both the Europeans and the U.S. will join Japan’s central
bank and start buying stocks too.
If our stocks start dropping like they did in 2008, you can bet
on it. It’s as if one
central banker comes up with an idea and all the others eventually
follow. Goldman Sachs notes
that the Chinese government bought at least CNY1.8 trillion of equities
in the second half of last year.
The global central
banks are pursuing unconventional policies into the abyss.
We will all be surprised just how far they go and it will
continue until everyone realizes this grand experiment failed.
Remember, monetary policy is being set by just a roomful of
academics. In July of 2007,
when many signs were flashing warning signals of the upcoming crisis,
here was Bernanke’s and the Fed’s forecast: “Overall, the U.S. economy
seems likely to expand at a moderate pace over the second half of 2007,
with growth then strengthening a bit in 2008 to a rate close to the
economy’s underlying trend.”
This is very similar to Janet Yellen’s and the Fed’s forecast
now.
Joseph R. Gregory, Jr.