
DEFLATION AND INFLATION AT THE SAME TIME
January 9, 2015
As we enter the New
Year, the economic and market environment continues to wrestle with two
opposing forces. We are
seeing deflationary pressures from the growing global debt and subdued
economic growth while at the same time, inflationary pressures continue
from the monetary policies of global central banks.
Let’s take a look at both.
To start, let’s see
where the deflationary pressures are evident.
The chart below shows the U.S. 10-year Treasury bond yield.
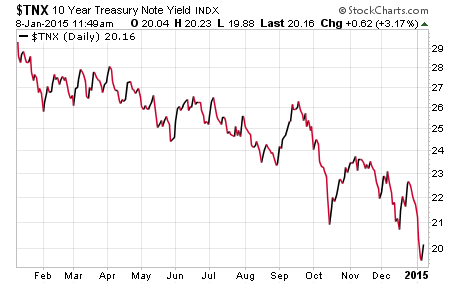
The 10-year yield has
dropped from around 3% a year ago to below 2% recently.
Next, here is the
10-year German Bund yield.
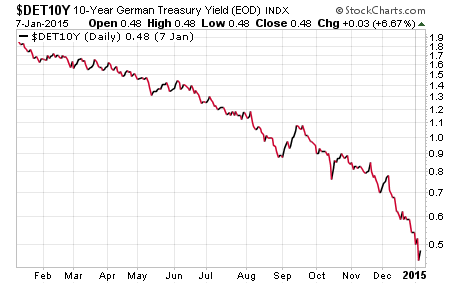
This drop is more
significant at it has fallen from about 1.8% a year ago to about 0.45%
recently.
Next, let’s look at the
10-year yield on Japanese government bonds.
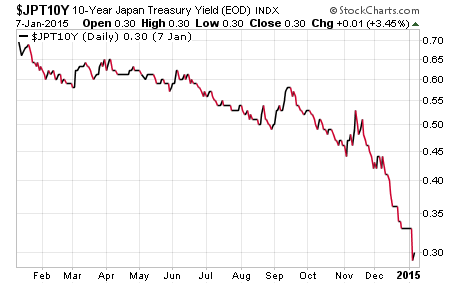
This yield has dropped
from around 0.70% a year ago to under 0.30% lately.
One explanation of the
drop in the yields of U.S. government bonds is that money is coming into
the best economy among weak established economies which is evident in
the strong rise in the U.S. dollar relative to the Euro and the Yen.
And, those money flows are going into our Treasury bonds driving
yields lower. However, if
that was the primary reason for the drop in yield we probably would not
be seeing a collapse in the yields of the government bonds related to
both of those currencies where money is leaving.
Now, let’s move to
another asset class, commodities.
Here we can take a look at metals, agriculture and the latest
obvious one, oil. First,
here is an ETF of industrial metals or some of the most used metals in
the economy such as copper, aluminum and zinc.
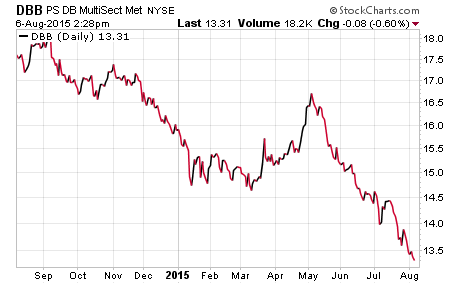
This chart shows the
decline over the last 5 months, which is about a 14% drop.
While agriculture
prices are more of a reflection of weather and plantings, it is still
interesting to take a quick look.
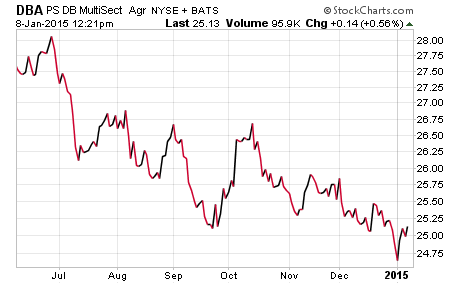
The chart above shows
about a 12% drop in agriculture prices such as corn, wheat and soybeans.
Next, here is a chart
that shows the collapse in oil prices.
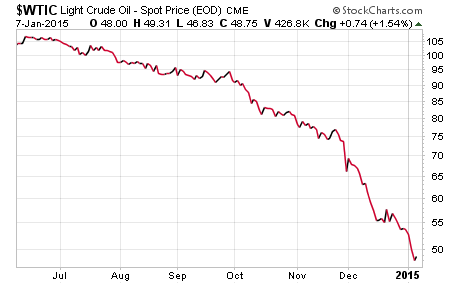
Oil prices have dropped
over 55% in the last 7 months.
Now, let’s take a look
at inflation expectations as shown in a chart by BofA Merrill Lynch.
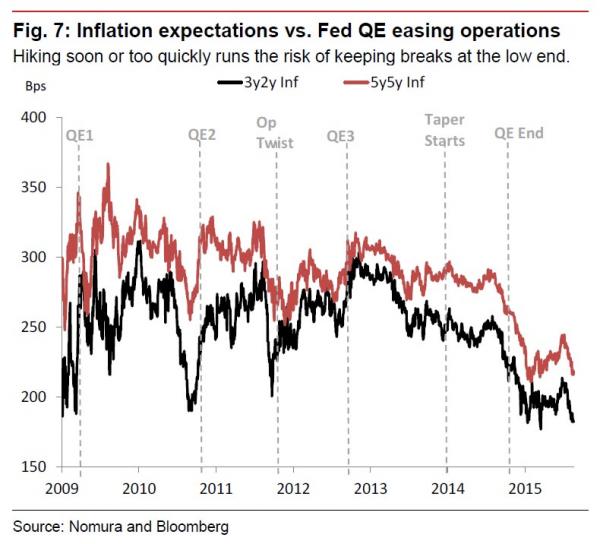
Without going into the
details of this metric, you can see by the trajectory of line at the end
of the chart, inflation expectations are dropping at an accelerating
rate. They are lower than
at any time since the financial crisis in 2008 and at the pace of this
decline, we are likely to see it break below that crash level soon.
So, what we are seeing
from a deflationary standpoint is global government bond yields
declining sharply, commodity prices dropping notably and inflation
expectations rapidly heading toward the lows at the peak of the scare
during the financial crisis.
The scare of deflation for economic and market participants is
that if it starts to accelerate then purchases in the economy are
delayed because purchasers believe they can get a better price the
longer they wait and economic activity is then in trouble.
Personally, I don’t mind a little deflation.
However, the Federal Reserve is especially worried about
deflation in this environment because they see inflation expectations
dropping sharply after printing all this money and keeping rates at
zero, and they know there is not a lot left in their arsenal.
The primary drivers of
the deflationary pressures are global debt and related weak economic
growth. The Geneva Report
is commissioned annually by the International Centre for Monetary and
Banking Studies. The latest
report takes issue with all the discussions around how debt burdens have
been reduced since the economic crisis in 2008.
The report discusses how there has been a rapid rise in public
sector debt among the developed countries and private sector debt in
emerging countries, especially China.
It reports that total world debt has risen from 160% of national
income in 2001 to 200% in 2009 at the end of the financial crisis to
215% in 2013. The IMF put
out a study reporting that global debt markets have risen from $70
trillion in 2007 to $100 trillion in 2013.
INFLATION CAN BE IN MANY
FORMS…
Now, let’s turn to
discuss where we are seeing inflation in the current environment.
Here, I am not talking about the rising cost of education and
healthcare as I see that being an issue with the dynamics of the way
those sectors are structured, funded and operate; both of which are
highly dysfunctional.
Instead, it is inflationary pressures that are coming from global
central bank monetary policies.
To illustrate just how extreme monetary policies have been and
are going, we can look at the chart below from resilience.org from
googling global central bank balance sheets.
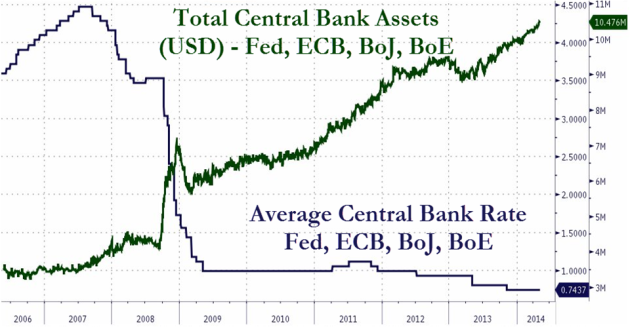
The chart above shows
the combined balance sheets of our Fed, the European Central Bank, the
Bank of Japan and the Bank of England in the dark green line.
Then, the average of the yields controlled by these central banks
is in the dark blue line.
This illustrates just how extreme monetary policy has gone and it is
going to get even more extreme.
We have never seen this in history.
Economic theory would
indicate that all of this easy money will create inflation.
Well, the inflation so far has not shown up in the real economy
such as wage inflation and commodities but rather in financial asset
prices; i.e., the stock market.
The central banks have
printed all this money and moved rates of return on safe assets for
savers to basically nothing.
So, where do the savings stored up go?
Instead of the money going into consumption, as reflected by weak
global consumption, much of it has gone into riskier financial assets.
However, the plan by the Fed to ramp up the prices of financial
assets to create a wealth effect so as to encourage consumption, so far
has not worked.
INTERESTING EARNINGS
ENVIRONMENT…
The issue with
investors chasing the inflation in stock prices is that it is based more
on the manipulation by central banks through monetary policy, when the
fundamentals are more in sync with the deflationary forces reflected in
government bond yields and commodities.
If you listen to the financial media they justify stock prices
rising because earnings are doing well.
But, then when asked why are global bond yields crashing along
with declines in commodities which reflect economic activity such as
base metals and oil, they say it is due to weak global growth and
deflationary pressures.
Now, how do you get improved earnings from weak global growth and signs
of deflation?
To try to reconcile
this, you can look at profit margins and financial engineering.
First, let’s look at profit margins.
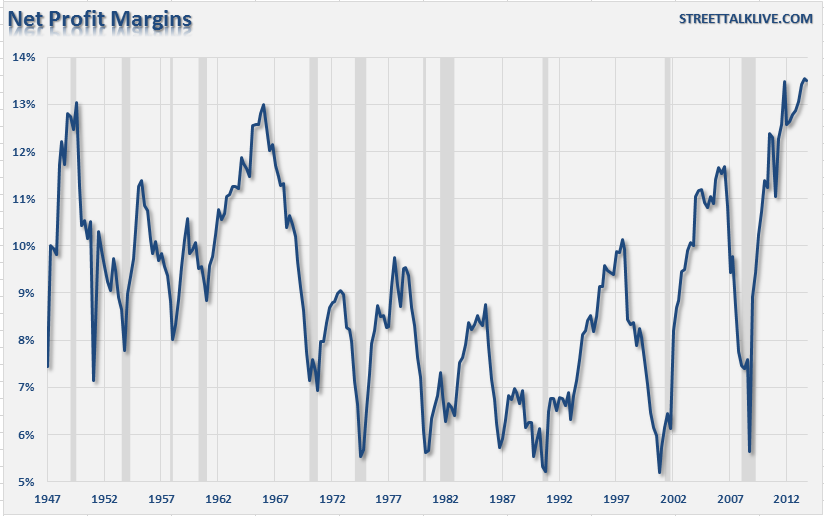
As you can see by the
chart above, corporate profit margins are at record highs.
The chart also illustrates that margins tend to be very mean
reverting and do not stay abnormally elevated or depressed for very
long. If you look at the
deflationary pressures, corporate inputs from commodity prices, to wages
they pay, to reductions in interest expense from low rates have all
contributed to the record margins.
Also, financial
engineering has dramatically contributed to earnings.
Here is a chart of corporate debt.
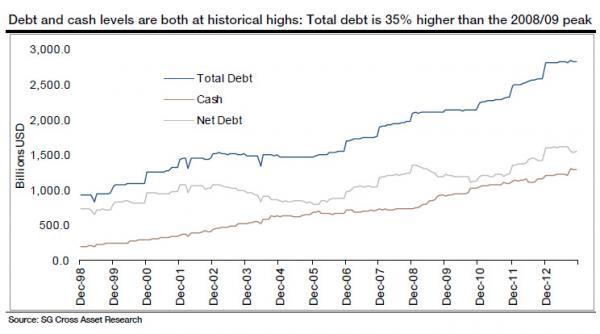
This chart shows that
total corporate debt is 35% higher than the ‘08/’09 peak.
Once again, we see that monetary policy has encouraged
corporations to take on more debt.
So, what have the corporations spent all this money on?
Capital expenditure numbers have been very muted indicating that
they are not finding an abundance of attractive new investments to
pursue, especially in the environment of weak global demand.
So if you can’t find new capital projects to invest in for future
growth, what can you do to help with earnings?
The answer is, reduce the number of shares outstanding by buying
back your own stock. After
all, earnings per share is calculated by the earnings of a company
divided by the number of shares outstanding.
It is estimated by Standard and Poor’s that companies spent $565
billion this past year on buying their own stock back.
Even with subdued
revenue growth, these dynamics have helped dramatically with making
current price/earnings multiples look more reasonable.
That is why it is a good time to use valuation metrics that
smooth out dynamics such as unusually high profit margins coupled with a
surge in corporate buybacks, such as CAPE [cyclically adjusted price
earnings ratio]. These
valuation metrics are significantly elevated now.
However, financial
engineering of using the effects of monetary policy to issue low cost
debt and fund significant increases in share buybacks doesn’t last
forever. IBM is a perfect
example where eventually top line revenue growth is needed to justify
stock price levels and the benefits of corporate buybacks run their
course. Caterpillar is
another one to watch among many others.
THIS INFLATION ENCOURAGES
RISK TAKING…
So, we have monetary
policy not only encouraging investors to chase stock prices but also
providing the means for corporation to issue cheap debt to fund buying
back their own stock. The
longer the muted fundamentals and deflationary forces continue, the
longer the extreme monetary policies will go on.
However, weak fundamentals and deflationary conditions discourage
capital spending by corporations which is the fuel for future growth,
and future growth is eventually required to support stock prices.
The Fed eliminating any
return on safe assets also tends to encourage investors to extend their
investments further and further out the risk curve over time.
As more investors move incrementally into riskier assets to find
yield and return, those yield and return opportunities are marginalized.
Investors then take the next increment of risk to generate the
same return as they had before in a safer asset.
They enjoy the asset price inflation created by the Fed until
they realize that the assets they now hold are not supported by the
underlying fundamentals found in weak global growth and deflationary
pressures.
COULD FED POLICY ACTUALLY
CREATE DEFLATION???
Now, here is an
interesting scenario that I have not heard discussed among financial
pundits or economists. When
the Fed prints a ton of money and keeps rates at zero for very long
periods of time, everyone expects inflation.
What if we really are getting the expected inflation now in the
form of asset price inflation?
It is the kind of inflation investors love, at least while it
lasts. But, what if the Fed
turns out to be sowing the seeds of much more dangerous global deflation
by the very policies they currently believe are fighting deflation?
What is a side effect
of all this easy money? It
is cheap and easy debt. As
I discussed above, global debt keeps rising at a rapid rate encouraged
by all this “free” money sloshing around the world from the global
central banks, and led by our Fed.
Now, what is a primary
driver of “bad” deflation?
It is deleveraging from high debt levels.
So, while the Fed believes it is fighting deflation with their
policies, we get asset price inflation but deflationary pressures are
still building in a number of areas of the real economy.
The wealth effect they have been looking for is not helping them
address the deflationary pressures they are seeing.
We may see this Fed “medicine” turn out to be fuel for the
deflation fire as the global economies have to eventually address the
massive debts they are financing from Fed policies.
That will be really interesting if the global debt bell rings at
a time when the global central banks have few bullets left.
PAVLOV’S DOG KEEPS BUYING
WHEN THE FED SPEAKS…
On that cheery note,
let’s look at how the market continues to be battling the slowing global
growth but trained to rally on the Fed.
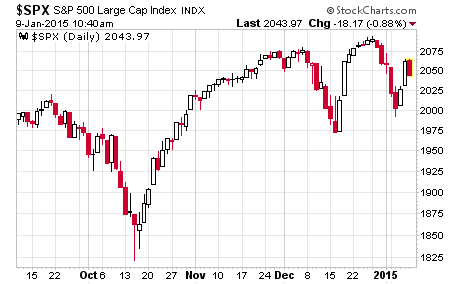
The chart above shows
the action of the S&P 500 since September.
The market started dropping in late September into mid-October.
Then, right at the lows, James Bullard of the Fed came out and
said that they may not end QE like they were planning.
The market immediately started to rally through November.
Then, the market started dropping in early December until the day
of the Fed meeting in which they sounded relatively dovish as far as
raising interest rates and the market once again had an immediate pop.
Next, the market had its worst three days of a new year ever and
what do you know, but another Fed member, Evans, came out and said that
it would be a catastrophe if the Fed were to raise rates anytime soon
and markets pop once again.
It seems now that anytime the market starts to look like it could have a
more meaningful correction, the Fed sends out a member to talk it back
up again. It seems that the
weak global growth is weighing on stock prices but the market is so
conditioned to respond to the words of the Fed that we get this type of
action.
GOLDMAN’S SENTIMENT
INDICATOR…
Before I close for this
month, it is interesting that we ended last year with one of Goldman’s
sentiment indicators at its highest possible level.
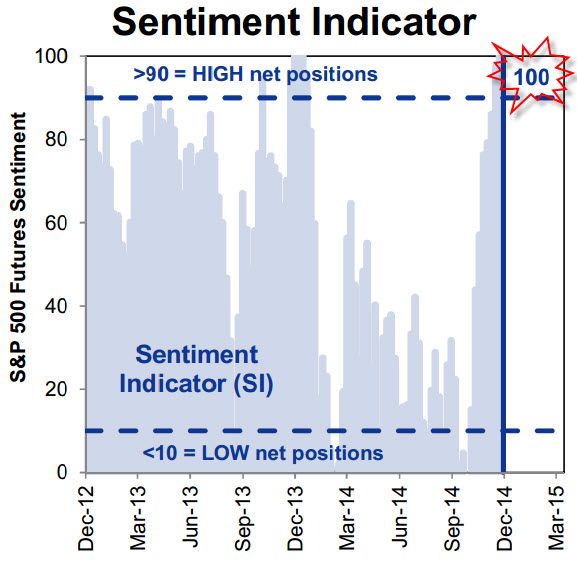
This indicator is shown
above and represents net positions on S&P 500 Futures contracts.
It was floored at 100 meaning investors were positioned for
maximum future gains from rising stock prices.
This tends to be a contrarian indicator and what followed was the
worst three day start to a new year ever, as I mentioned above.
This positioning may not have been worked down just yet.
As I close for this
month, it is worth mentioning that I have seen an unusually high amount
of distribution under the surface of the market since the beginning of
December. I track buying
and selling pressure on a daily basis by looking at price and volume
movements on the major exchanges.
If this selling pressure continues to build while stock prices
are near their highs, it will likely mean corrective forces will take
hold.
COMMENTS WORTH CONSIDERING…
Also, crashes in the
price of oil are usually associated with unpleasant developments in
financial markets. Here are
a few comments from Jeffrey Gundlach, who is viewed as the new bond king
in financial circles.
“Something between 14%
and 19% of the junk bond market is energy related.
So when you have oil prices
staying where they are for several months
– which is likely because that is a policy decision that some oil
producers have made – some of these companies will start to really run
into financial troubles.
Now, some people are saying:
‘That is confined to energy, it is a pocket of the economy,
everything else is OK and insulated.’
But that argument usually does not work.
When the housing market started to get weak in the subprime
category, even Ben Bernanke said: ‘That does not matter, it is just
subprime.’ But, things are
linked together.”
And for those who are
banking on oil prices providing a net benefit to the economy, here is a
quote from Ray Dalio, the founder of the largest and one of the most
successful hedge funds in the world.
“In its November 14,
2014 Daily Observations (‘The Implications of $75 Oil for the US
Economy’), the highly respected hedge fund Bridgewater Associates, LP
confirmed that lower oil prices will have a negative impact on the
economy.”
“After an initial
transitory positive impact on GDP, Bridgewater explains that lower oil
investment and production will lead to a drag on real growth of 0.5% of
GDP.”
“The firm noted that
over the past few years, oil production and investment have been adding
about 0.5% to nominal GDP growth but that if oil levels out at $75 per
barrel, this would shift to something like -0.7% over the next year,
creating a material hit to income growth of 1-1.5%."
He wrote this
identifying the issues with oil at $75 and it is now at $47, a full 37%
lower.
With oil at $47, here
is a final recent quote from Gundlach.
“Oil is incredibly important right now.
If oil falls to around $40 a
barrel then I think the yield on the ten year Treasury note is going to
1%. I hope it does not go to $40
because then something is very, very wrong with the world, not just the
economy. The geopolitical
consequences could be – to put it bluntly – terrifying.”
To balance these risks
voiced by Bridgewater and Gundlach, David Tepper, another highly
respected investor believes that stock prices may elevate even more.
His rationale is that the European Central Bank is going to be
forced to come into the market soon with significant QE, or money
printing, and we get further asset price inflation since the “free”
money is going into financial assets rather than the real economy.
In light of the growing
cross winds, the environment should provide a very interesting year
ahead for investors to navigate.
We are living in historic times with respect to monetary policy,
economic repercussions and financial asset prices.
Enjoy the ride!
Joseph R. Gregory, Jr.